Welcome to the Afibber’s Forum
Serving Afibbers worldwide since 1999
Moderated by Shannon and Carey
 |
 |
 |
 |
 |
 |
Home
>
AFIBBERS FORUM
>
Topic
Post ablation Kardia interpretations
Posted by IDbill
|
Post ablation Kardia interpretations August 12, 2021 10:41AM |
Registered: 5 years ago Posts: 29 |
The good news (why I have not been on this forum lately!): Dr. Natale ablated me 26 months ago and I have been nominally AF free since (at least according to sporadic check ups and semi-annual TCA Zio patch monitorings). Feel great and am off all anti-coagulants.
The bad (or, al least troubling) news: since my AF had become persistent and asymptomatic (cardiologists surprised me in informing me that I was 'in AF'. My only self-indication was that I was feeling far more dragged when running, cycling, swimming, etc.) I am warned, as is typical, to immediately begin taking OACs if I relapse into AF. So, how to self-monitor, say daily, between Dr. check ups or Zio moniotrs?? Since before my ablation I had been using a Kardiamobile for this purpose (easy, convenient for multiple daily ECGs). This was even recommended by TCA! However, as I have come to appreciate, the Kardia App. summarizes each ECG with only a very loose indication ( 'Normal'; 'Unclassified'; or 'possible AF'). It can be easily fooled by sundry other, more begnin irregularities (premature atrial and premature ventricular beats in my case).to indicate 'possible AF'. So, in a typical day I am finding many 'possible AF' indications (although, after many tries during a day I would ultimately achieve a 'Normal' indication). Of course, if I were an EP expert I would be able to discern (as the TCA nurses have done with Kardia ECGs I have subsequently sent them) that these false 'possible AF' reads were actually sinus. However, not being an expert I hesitate to 'second guess' the nominal Kardia indication. So I am not at all able to trust Kardia for its main benefit: to give immediate indication of an AF episode to allow timely commencement of OAC.
I have been back/forth with TCA on this dilemma, with no clear resolution. On the one hand they admit there is an issue wrt these loose Kardia indications. On the other, they can only suggest sending them my 'false' 'possible AF' ECGs for expert evaluation (so far these have always been deemed actually sinus (with sundry premature beats). However this is un-managable since 1. there are far too many such 'false' ECGs for either they or me to deal with and 2. there would not be any 'immediate' feedback for prompt OAC start up! I have, so far, not been able to have (TCA) explain/coach me on how to properly 'read' the Kardia ECGs to discern, in more detail, whether AF is occuring
Any suggestions on this; in particular some 'tutorial' on what the true halmarks of AF are to look for in an otherwise possibly 'messy' ECG?
|
Re: Post ablation Kardia interpretations August 12, 2021 07:02PM |
Registered: 11 years ago Posts: 4,220 |
IDbill,
I'm not an ablatee, but I'll share what I've done with Kardia strips that people have sent me and asked for my opinion.
One hallmark of afib is randomly random. You can visually look at a Kardia strip and see the variability. However it can be difficult to differentiate between other situations that can have variability. A way to visualize this better is to measure the duration of each beat an plot it as a "tachogram."
Years ago, some of us used recording, beat to beat heart rate monitors that would do this. One of our members, Mark from the UK, sent a file of these tachogram graphs with a plethora of different rhythms. These graphs are plotted as beat to beat heart rate vs time. However the visual will be the same with beat to beat time (in milliseconds) vs clock time.
[www.afibbers.org]
On the first graph on p2 of the PDF, you can see the variable variability of afib.
On the graph on p28 of the PDF, there are a many PAC beats followed by a compensatory beat. However notice there are "regular" beats in between. So this is NSR with a lot of PDF's. Note there is normal variability beat rate/duration in NSR, but is a few beats/minute, not 20-60 or more.
I take a scale/ruler to a printed version of the Kardia and measure the distance between beats. I then plot this manually or with Excel or another graphing program. This does take a bit of time, but it does help discriminate between afib variability and ectopic beat variability around an NSR baseline.
George
|
Re: Post ablation Kardia interpretations August 12, 2021 08:58PM |
Admin Registered: 6 years ago Posts: 5,332 |
If you want to keep a record then go with George's suggestion. But if you just want to check a recording quickly without numbers of calculations, go down to the nearest store that sells office or school supplies and buy an inexpensive protractor. You can then easily measure the distance between R waves without the need for numbers and computations. Just pick a starting point in the recording that's not at the very beginning, put one pointer of the protractor on the top of the first R wave, move the second pointer to the next R wave. Now use those two pointers to compare the distance between the following R wave pairs. The pointer should land very near to the next R wave almost every time. Some variability is normal, and one or two big discrepancies here or there is also normal, but if there's a big discrepancy on almost every pair of R waves, that's afib.
I bet there's a video on youtube showing how to do this. Check it out.
I bet there's a video on youtube showing how to do this. Check it out.
|
Re: Post ablation Kardia interpretations August 12, 2021 09:19PM |
Registered: 11 years ago Posts: 4,220 |
Quote
Carey
Some variability is normal, and one or two big discrepancies here or there is also normal, but if there's a big discrepancy on almost every pair of R waves, that's afib.
.
Where this falls apart is something like this, which is an image from p 28 of the PDF I linked above.
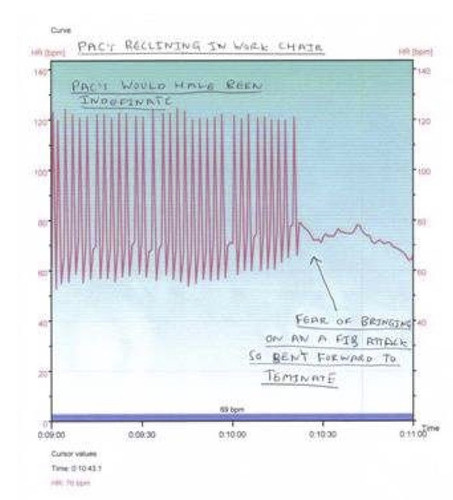
You will see a lot of big discrepancies between nearly every pair of R waves, but it is still NSR. If you don't plot it out, you miss this. There are other patterns of ectopics, within NSR that can also show a lot of big RR discrepancies.
|
Re: Post ablation Kardia interpretations August 13, 2021 08:27AM |
Registered: 11 years ago Posts: 4,220 |
Turns out that Kardia will do this for you. Make sure your Kardia app is updated to the latest version. If your app automatic updates are not on, go to your app store (iOS), Google Play Store (Android) and update it.
1st, create a PDF for the reading
2nd, on my single lead (not 6L) Kardia, there is a heart rate vs time graph on the second page.
The left Y-Axis is the beat time in milliseconds, the right Y-Axis is in beats per minute. Note that the small boxes represent 4 BPM.
This graph is afib at an average BPM of 104. The middle right beats at around 96-100 BPM look like NSR & could be atrial flutter, which typically presents with a very steady HR. Many of the other beats have very large variability, note the beats especially on the far left and right.
Edited 1 time(s). Last edit at 08/13/2021 09:20AM by GeorgeN.
|
Re: Post ablation Kardia interpretations August 13, 2021 10:54AM |
Registered: 5 years ago Posts: 29 |
|
Re: Post ablation Kardia interpretations August 13, 2021 04:20PM |
Registered: 11 years ago Posts: 4,220 |
Quote
IDbill
if Kardia now has this data reduction/algorithm feature, which according to you is a sure idicator of Afib, then why does Kardia not use such a straightforward result as their summary indication of 'possible Afib' ??
Though I can see the PAC example above visually, it might be harder to write an algorithm saying it is PAC's & not afib. In my first post, above, I linked a PDF with many different examples. Quite a few are of long duration - an hour or more. The shortest is maybe a minute. A longer time span is easier to interpret than a 30 second strip. I think you could do up to 5 minutes on the Kardia, but is more of a pain to sit there and take the reading. With the Polar chest strap recording as in the PDF, it is much easier to do longer recordings. If the ECG is regular and low rate, then it is pretty sure it is NSR. If it is irregular, then you have to pay attention to see if the irregular beats are ectopics, perhaps interspersed with NSR or actually afib. There is interpretation involved and may not be as straightforward as we've presented. I've been looking at these charts for a long time, so have a lot of experience.
I have no idea what their algorithm looks at. In your case, is it a missing "p" wave due to the ablation, but the beats are still regular? The two thumb - Lead I presentation for the ECG doesn't project a strong 'p" wave anyway. Lead II, which would be left knee to right hand, does a better job. You can do this with the cardia, though not through pants.

|
Re: Post ablation Kardia interpretations August 13, 2021 08:30PM |
Registered: 5 years ago Posts: 29 |
Thank you, George. I definitely want to explore this 'time series' HR graphing. I have only the original (2 lead) KardiaMobile with NO Kardiacare package. Not sure, then, that I can access this graphing feature. In any case I can find no 'button' in my App screens (I am on Android) which allows for a version update (or even any readout of what version I have.... mine has been going the same for 2-3 years). Of course they have plenty of Adverts. for upgrading to their kardiacare package which includes what they call "Advanced Determinations" to "get a deeper look at your heart rhythm? Is this the upgrade you refer to (in which case it evidently requires more than just a simple version update)?
|
Re: Post ablation Kardia interpretations August 13, 2021 09:16PM |
Registered: 11 years ago Posts: 4,220 |
Quote
IDbill
Thank you, George. I definitely want to explore this 'time series' HR graphing. I have only the original (2 lead) KardiaMobile with NO Kardiacare package. Not sure, then, that I can access this graphing feature. In any case I can find no 'button' in my App screens (I am on Android) which allows for a version update (or even any readout of what version I have.... mine has been going the same for 2-3 years). Of course they have plenty of Adverts. for upgrading to their kardiacare package which includes what they call "Advanced Determinations" to "get a deeper look at your heart rhythm? Is this the upgrade you refer to (in which case it evidently requires more than just a simple version update)?
See if you can do what they suggest here to create a pdf: [alivecor.zendesk.com] That is where this graph is located.
|
Re: Post ablation Kardia interpretations August 13, 2021 09:41PM |
Registered: 5 years ago Posts: 29 |
Unfortunately, those alivecor instructions don't resolve my puzzle. I have never had any trouble creating and downloading the ECG PDFs of any Kardia trial I perform (I keep an extensive archive of them on my PC and, when necessary, forward some to TCA). However NONE of them have a 'second page' with the HR graph you have shown me! Indeed, I may be running an older version, but cannot find any version info or menus to update that.
|
Re: Post ablation Kardia interpretations August 13, 2021 11:55PM |
Admin Registered: 6 years ago Posts: 5,332 |
Quote
GeorgeN
You will see a lot of big discrepancies between nearly every pair of R waves, but it is still NSR. If you don't plot it out, you miss this. There are other patterns of ectopics, within NSR that can also show a lot of big RR discrepancies.
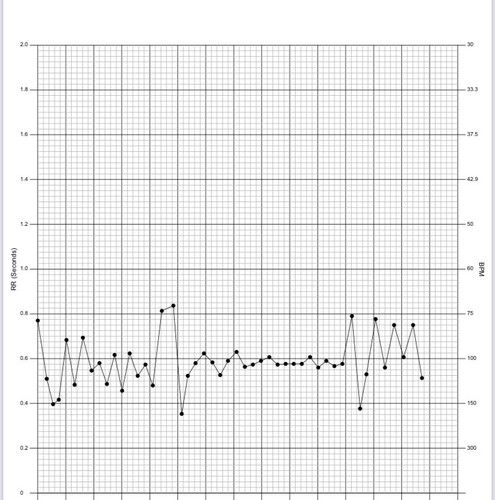
That image is very low res and blurry, but I don't see big RR discrepancies between nearly every pair of R waves. I only see occasional discrepancies. I wouldn't call that recording afib. I think it's clearly frequent ectopics but not a sustained arrhythmia.
|
Re: Post ablation Kardia interpretations August 14, 2021 08:48AM |
Registered: 11 years ago Posts: 4,220 |
Quote
Carey
That image is very low res and blurry, but I don't see big RR discrepancies between nearly every pair of R waves. I only see occasional discrepancies. I wouldn't call that recording afib. I think it's clearly frequent ectopics but not a sustained arrhythmia.
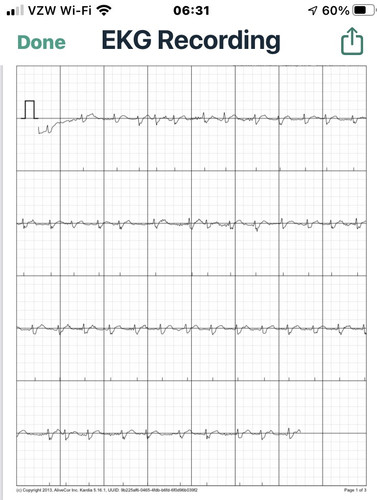
Look at the scale! A small box is 4 BPM. Count the boxes between the beats. Look at the first few pairs. Went from about 79 to 116 then to 151 then 147 and 87. Unfortunately my Polar app disconnected from the strap and I lost those data during this Kardia reading or I could display that, too. I have lots of other examples I could post. BTW reported as afib by Kardia. Here is the ECG. I assure you it was afib. It was in the middle of a 9 hour episode. On resolution, you can double click the image and bring up a higher res image. This works on both my phone and computer.
Edited 1 time(s). Last edit at 08/14/2021 08:49AM by GeorgeN.
|
Re: Post ablation Kardia interpretations August 14, 2021 10:44AM |
Registered: 5 years ago Posts: 29 |
Quote
GeorgeN
See if you can do what they suggest here to create a pdf: [alivecor.zendesk.com] That is where this graph is located.
I am able to generate the standard Kardia ECG PDFs..... have been doing that all along! However they do NOT include the HR graphs you have mentioned/shown. My Kardiamobile App. (on Android) works fine, but I have not been able to locate any version information or menu for updating it.
|
Re: Post ablation Kardia interpretations August 14, 2021 11:16AM |
Registered: 5 years ago Posts: 29 |
OK, I have been able to locate the Kardia App. version I have been using: it is 5.17.3-01be14300
This is called out as being the latest version (as of July 15, 2021).
So, I seem to be operating with the current version. However this does NOT generate the HR graphs along with the ECG PDFs.
This is called out as being the latest version (as of July 15, 2021).
So, I seem to be operating with the current version. However this does NOT generate the HR graphs along with the ECG PDFs.
|
Re: Post ablation Kardia interpretations August 14, 2021 01:13PM |
Registered: 11 years ago Posts: 4,220 |
Quote
IDbill
OK, I have been able to locate the Kardia App. version I have been using: it is 5.17.3-01be14300
This is called out as being the latest version (as of July 15, 2021).
So, I seem to be operating with the current version. However this does NOT generate the HR graphs along with the ECG PDFs.
Is there someone in your household with another phone you could set up a new account on? They are supposed to give you 30 days free for the paid features. I assume this must be a paid feature. I got my Kardia account in 2014, and when they started charging an ongoing fee for more features, I was grandfathered in without cost. Hence I do get the paid features. I don't see that chart/analysis mentioned in the latest app manual I could find, which was dated January 2020.
|
Re: Post ablation Kardia interpretations August 14, 2021 05:15PM |
Admin Registered: 6 years ago Posts: 5,332 |
Well, you kind of lost me with the various recordings. I'm not sure I remember what the point was. But for sure doctors have been analyzing ECGs with calipers for as long as there have been ECGs, and that's always been the default method of diagnosing afib. Sure, you can bring new technology into play, but my point was simply that you don't really need technology to identify afib in an ECG.
|
Re: Post ablation Kardia interpretations August 15, 2021 06:04PM |
Registered: 11 years ago Posts: 4,220 |
Quote
Carey
Well, you kind of lost me with the various recordings. I'm not sure I remember what the point was. But for sure doctors have been analyzing ECGs with calipers for as long as there have been ECGs, and that's always been the default method of diagnosing afib. Sure, you can bring new technology into play, but my point was simply that you don't really need technology to identify afib in an ECG.
Carey, my point is whether you use dividers, count the "dot" boxes on a Kardia strip (2 1/2 BPM for each), look at the heart rate vs time graph that Kardia supplies to some customers or a Polar heart rate monitor strip is that just considering 3 or four R to R pairs may not give context and that there are many different rhythms with many ectopics that may be mistaken for afib because of the variability without that context. IDbill is not experienced looking at ECG strips. His post ablation ECG's have a morphology or character that the Kardia algorithm thinks is afib, but the trained eyes of Natale's staff say is NSR. So my point is to look at as much data as you have & ideally plot it out so the patterns of either random variability or uniformity within highly variable data become apparent.
An exercise is to go through the PDF from our site I linked to and ask, "what would this look like on an ECG examined with a pair of calipers?" [www.afibbers.org] I chose this example (posted above) of a PAC storm in NSR as a case where a cursory look with a pair of calipers could lead someone to conclude it was afib, because of the R to R variability.
|
Re: Post ablation Kardia interpretations August 15, 2021 06:10PM |
Registered: 5 years ago Posts: 29 |
As you and I had begun to suspect, the graph form you presented is ONLY available with their premium subscription. Per my contact with Kardia support:
The R-R interval plot is only available to Kardiacare subscribers along with our asdvanced determinations you will not have access to this information under a basic account and will have to upgrade in order to be able to see the information in question.
So you were lucky to be 'Grandfathered'! Sure, I could do a 30 day trial of this with Alivecor (they offer that even if one is a current user but non-premium). However this would not fit my need to have a long term 'short cut' for identifying AF. I prefer not subscribing an ongoing monthly fee merely to be able to display the same data contained in the ECG in a different manner. This makes me extremely dissapointed with Kardia, I can see them charging for most of the kardiacare enchancements since these are truely additional services. However, withholding the R-R interval plot seems arbitrary/capricious since the information contained is nothing additional. They might just as well have withheld the ECG and only supplied the R-R plot!! In the end they are just another profit driven corporation marketing the product up to maximally entice tentative customers into subscribing for more
|
Re: Post ablation Kardia interpretations August 15, 2021 06:50PM |
Registered: 11 years ago Posts: 4,220 |
Quote
IDbill
As you and I had begun to suspect, the graph form you presented is ONLY available with their premium subscription. Per my contact with Kardia support:
Sorry to hear that!
Sounds like this is frequent. You could go through the effort of doing this manually, with dividers as Carey suggests, counting and eyeballing dot "boxes" on the PDF output or whatever. If you do this a few times, you might determine you could do it visually with the ECG. I could probably do it in under 5 minutes on a 30 second strip eyeballing the number and fractions of dot "boxes" between R peaks. Wouldn't possibly even need to plot, just write down the number of boxes (or convert this number to beats per minute by multiplying by 2.4) and then look for patterns.
Quote
Carey
Well, you kind of lost me with the various recordings. I'm not sure I remember what the point was. But for sure doctors have been analyzing ECGs with calipers for as long as there have been ECGs, and that's always been the default method of diagnosing afib. Sure, you can bring new technology into play, but my point was simply that you don't really need technology to identify afib in an ECG.
Carey, my point is whether you use dividers, count the "dot" boxes on a Kardia strip (2 1/2 BPM for each), look at the heart rate vs time graph that Kardia supplies to some customers or a Polar heart rate monitor strip is that just considering 3 or four R to R pairs may not give context and that there are many different rhythms with many ectopics that may be mistaken for afib because of the variability without that context. IDbill is not experienced looking at ECG strips. His post ablation ECG's have a morphology or character that the Kardia algorithm thinks is afib, but the trained eyes of Natale's staff say is NSR. So my point is to look at as much data as you have & ideally plot it out so the patterns of either random variability or uniformity within highly variable data become apparent.
An exercise is to go through the PDF from our site I linked to and ask, "what would this look like on an ECG examined with a pair of calipers?" [www.afibbers.org] I chose this example (posted above) of a PAC storm in NSR as a case where a cursory look with a pair of calipers could lead someone to conclude it was afib, because of the R to R variability.
Edited 1 time(s). Last edit at 08/15/2021 06:54PM by GeorgeN.
Sorry, only registered users may post in this forum.